
Acknowledgements
I want to thank everyone who took the time to review early drafts and share thoughtful feedback, including:
- Katherine Coatta and Stephen Reichert from the Evaluation outfit Reichert and Associates
- Dr. Daisy Dulay (Cardiologist, Current Specialist Services Committee Co-Chair, Provincial Leader in QI and Whole System Quality, HDC Board Member)
- My previous team at Hope to Health:
- Dr. David Cook (Family Physician and Assistant Medical Director, PQI Level 3 Alum)
- Dr. Silvia Guillemi (Family Physician and Interim Medical Director)
- Dr. David Moore (Family Physician and Research Scientist in Health Service and Population Health)
- Angie Semple (Quality Leader)
- Kriti Manuja (Quality Project Coordinator)
- Chase Fisher (Clinical Pharmacist and PQI Level 3 Alum “dyad partner”)
In writing this piece, I’ve learned a great deal. What stood out most is how often people across our system – coming from evaluation, research, analytics, or quality backgrounds – are trying to solve similar problems but using different words. This article is an attempt to bring those perspectives together, highlight overlaps, and build a shared language so we can partner more effectively to improve outcomes for patients, teams, and communities.
///
Circle 9 – The Wrong Toolkit – Clinical Data Stewardship Committee (CDSC) version
The hellevator clunks and jolts downwards yet again. The door creaks open, and you’re greeted not by brimstone, but a thick haze of professional confusion. In one corner, a surgical team stands over a fully prepped patient, puzzled as the nurse unzips a backpack and pulls out a tiny cheese board, metal cutlery, and champagne flutes. Nearby, a hunched technician hammers away at a laptop wearing a hard hat, wielding heavy duty tools from a construction belt. Further afield, a chef frantically attempts to sauté some onions with a cello bow. Welcome to Circle 9, where the tools aren’t broken, they are catastrophically misapplied.
Before we descend any further, here’s the point: Using the wrong measurement tools and techniques for the wrong purpose slows us down, exhausts our teams, and wastes our data. We need to match tool to task. This means understanding the differences between Quality, Research, and Evaluation. It also means asking three simple questions up front:
What’s the purpose?
Who’s asking?
What will they do with the result?
In any system, especially in complex adaptive ones like primary care, we do best to start with a shared understanding of what Quality means in our local context. This is the foundation for Whole System Quality (WSQ) – an approach that prioritizes planning, improving, and sustaining improved outcomes that truly matter to patients and teams. When we define these quality outcomes together, we can align system design, measurement, and improvement work.
Any team can begin this work. Training in QI and WSQ methodologies strengthens the process, but the starting point is a shared commitment to defining and measuring what matters. Without a clear, shared understanding of the quality outcomes we’re striving for, or a strong, embedded frontline Quality function – we risk wasting time, eroding trust, and failing to improve care.
In this Circle of Healthcare Data Hell, the sin isn’t the absence of effort, but the use of The Wrong Toolkit for the job. It’s what happens when we conflate methodologies or grab the most familiar or shiniest analytic hammer then proceed to see nothing but statistical nails.
If all you have is a p-value, you’ll ask every little improvement project to stand trial.
This is an especially tempting trap for healthcare professionals, many of whom were trained in the rigours of clinical research. We’re conditioned to privilege randomized controlled trials and significance thresholds – the mighty p-value, something that tells you if the result is unlikely to be by chance, but doesn’t get to how much the finding matters, or as the authors of The Cult of Statistical Significance say, it’s ‘oomph’.
OOMPH! – The non-significant can still matter, after all. Imagine a clinic pilot that phones ten high-risk patients every week. After one month, 6 out of 40 patients in the phoned group miss their follow-up vs. 10 out of 40 in usual care, a 40% relative drop. Because the sample is small, the p-value lands at 0.06, technically “not significant”, yet the absolute effect (four fewer missed visits per 40 patients) is large and the intervention is cheap. To get “statistically powered results” may not be feasible in the context of a QI project. In a situation like this the right move is to run another rapid test of a change (PDSA) and keep plotting the run chart, not abandon the idea. We miss out if we just gaze at the *stars* of p<0.05 – Remember to ask “what’s the oomph?!”
The world of QI isn’t a sterile lab, it’s a messy workshop. And more than just that, it’s a necessary part of our day jobs. Part of why we reach for the wrong toolkit is that medicine trains us to be deeply uncomfortable with uncertainty – and RCTs are partly so seductive because they promise to collapse that uncertainty into a clean yes/no answer. But primary care doesn’t work that way. Trying to prematurely eliminate complexity and uncertainty – demanding definitive proof before acting – is itself a form of paralysis. The discomfort of not knowing is the starting condition for improvement, not a problem to be solved before you can act. Misusing measurement frameworks doesn’t just waste time – it can delay action, demoralize frontline teams, and ultimately harm patients through opportunity cost. In healthcare, the imperative to improve cannot be optional. As Don Berwick has long argued, improvement is a moral act.
EVIDENCE ZEALOTS – “’Where is the randomized trial?’ is, for many purposes, the right question, but for many others the wrong question, a myopic one.” – Don Berwick, JAMA, 2008. RCTs often miss context that matters. Studies on rapid-response teams (RRTs) show why: the 2005 MERIT cluster RCT reported no mortality benefit, but audits later revealed activation criteria were unclear and teams were called in fewer than one-third of qualifying events. Subsequent meta-analysis found benefit in hospitals that paired RRTs with clear activation rules, empowered nurses and adequate staffing (Dukes et al., JAMA Intern Med, 2019). Controlled trials can look neutral when essential contextual “ingredients” are missing. Quality surfaces those ingredients, evaluation documents them and research retests them elsewhere.
If we let the wrong tools paralyze our ability to respond to what we already know, we allow preventable suffering to persist under the banner of scientific rigour. We miss the opportunity to create an adaptable theory for change (ToC) that takes a best guess about how our complex world works, and not only take actions if backed by randomized controlled trials (RCTs). Think evidence-informed vs. evidence-based. I used to be one of these evidence zealots, and recall a time from residency when a well-intentioned pediatrics attending, possibly post-call, had a meltdown when I asked “but are there any trials showing that?” about his theory for nutrition in school-aged kids. Sorry!
A ToC also exists in Evaluation. Evaluators often use it prospectively to lay out the logic from inputs to impact, make assumptions explicit, and guide program design. It’s also revisited retrospectively to ask:
Did this actually play out as expected?
For whom?
With what value and equity impact?
It’s built to inform accountability and funding decisions, often over quarters or years, using mixed methods and contribution/attribution analyses.
UNFAIR EVALUATION – A common misconception is that Evaluation is largely a retrospective exercise. Stephen Reichert of Reichert and Associates says “The worst evaluations are the ones that happen at the end, as we miss any chance to course correct.”
The trap is using an evaluation-style ToC when the team needs to learn tomorrow, or calling something QI when the funder needs credible evidence of value, equity impact, or transportability.
| QI ToC = working model, iterative, adapted weekly or monthly. Often expressed with a driver diagram. | Evaluation ToC = structured logic model, ideally designed upfront, revisited over time, focused on accountability and value. |
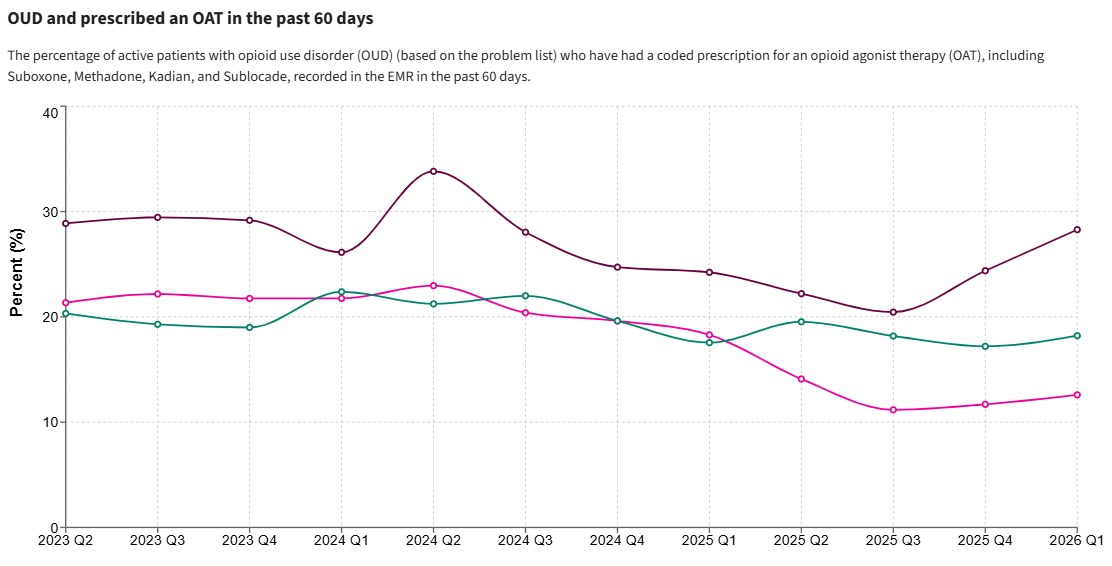
Let’s take a simple, high-impact example from primary care in Vancouver’s downtown eastside (DTES): trying to improve the proportion of clients with opioid use disorder (OUD) who are actively on opioid agonist therapy (OAT). Plenty of evidence has shown that retention on OAT yields myriad improved outcomes (reduced morbidity and mortality, reduced criminality, etc.) Yet in clinic settings like these, it remains difficult to keep people on therapy.
This is a complex systems challenge, and one ripe for improvement. In this context, many patients cycle on and off OAT. Some face stigma, barriers in accessing care, or difficulties tolerating some of the OAT options. But a lot of the improvement work needed does NOT require new pharmacological discoveries or complex RCTs. It requires better systems, with changes like:
- Assigning clear responsibility and process for OAT follow-ups
- Using EMR tools to track patients and flag those who have fallen off treatment
- Changing workflows to make re-initiation easier and more patient-centred
- Testing scripted lines that peer workers can say while attempting outreach
Changes like these are not typically tested in RCTs. Instead they are testable through Plan-Do-Study-Act (PDSA) cycles (Langley et al., The Improvement Guide) and outcomes are tracked using simple run charts or control charts (data over time). A team can see whether the new approaches increase the active OAT rate over time. Importantly, HDC’s data infrastructure is agnostic to purpose – the same clinical data that powers a frontline run chart can also support a research study or a program evaluation. The data doesn’t care which toolkit you’re using. That’s the point – it’s on us to choose the right one. Teams can adapt quickly to the results they’re seeing. They can learn and adjust within weeks. This is the heart of QI.
But what happens if we bring a research mindset here? We might get stuck asking:
- Where is the control group?
- Is the difference we are seeing statistically significant?
- Has this been published in a peer-reviewed journal?
These aren’t inherently bad questions, but it is the wrong time to ask them.
In this OAT example, a team may entirely skip measuring quality outcomes at the frontline and simply say “we tried our best to provide guideline-based care and apply what we learned in our medical training, so our job is done.”
WHERE DO THE EVALUATORS FIT? – In the OAT example, the frontline team may have detected a shift in the run chart and improved proportion of clients on meds. Evaluators can answer a different related set of questions: Is this working overall? For whom? At what cost? Were there equity implications? Is it worth sustaining and scaling?
Quality, Research, and Evaluation need to complement each other, and serve distinct purposes. The OAT example illustrates this nicely – each lens asks a different question and serves a different user. Research seeks to discover “what works in general” while Quality (specifically the QI piece) focuses on “making it work better” in our specific context, here and now. Evaluation can bridge the two, as evaluators help us understand why an intervention worked, what barriers remained, and how it fits in the broader system.
Whole System Quality (WSQ) takes a similar systems view to that of Evaluators, but seeks to embed this capability in the organization itself. Rather than relying solely on external evaluators to analyze system barriers or connect results to top-down policy, WSQ builds structures where end-users/customers, frontline teams, managers, and senior leaders together define key outcomes, measure progress, test changes, and sustain gains. In our current state, healthcare organizations often rely on external evaluators, largely leaving out the frontlines. WSQ can complement Evaluation by building in the internal day-to-day muscle to continuously measure and improve and connect local change to system priorities. A key role for Evaluators should be to help these organizations build this capability.
Here’s a simple comparison table:
| Quality | Research | Evaluation | |
| Primary tool user | Frontline teams, organizational leadership | Academics | Program designers, frontline teams, project managers, steering committees, program funders, policymakers, organizational leadership, key partners |
| Key question | How are we doing here and now and how do we make it better? | What is true and generalizable? | Is this intervention working? Why or why not? |
| Preferred tools | Run charts, control charts, PDSA cycles | RCTs, regression models, significance testing | Mixed methods, logic models, pre-post designs |
| What it informs | Rapid testing, system learning and adaptation | Generalizable knowledge, can inform which change ideas to test in QI | Implementation decisions, Funding decisions, policy, gaps where QI can be applied |
The key here is that each of these users has different decisions to make. Frontline teams need fast feedback to guide testing and implementation of what works. Researchers need methodological precision to reduce risk of bias. Funders and program leads need to know whether a program worked in its real-world setting and if it should continue.
Too often, in project proposals or new initiatives, we see an “evaluation plan” that invokes the term ‘evaluation’ in the broadest and vaguest sense. It’s often unclear:
- Who exactly is the intended audience or decision-maker?
- What actions will be taken based on the results?
- What tools and methods are best fit to support this?
When these questions aren’t answered up front, we risk wasting resources, misinterpreting results, or collecting data that serves no one. We fall into a trap each time we mismatch the tools to the purpose. We thrust performance dashboards in front of frontline teams, only to demoralize them as they lack the resources to improve. We erroneously frame QI projects as research and delay testing for years in pursuit of publishable precision. We forget that most improvement doesn’t require novel discovery- it requires applying what we already know with testing and implementation in our local context.
IMPLEMENTATION CRISIS – André Picard, arguably Canada’s most prominent health journalist, delivered this line in 2023: “We don’t have a health-care crisis in Canada. We have an implementation crisis.” This cuts to the heart of our dilemma: the problem isn’t always generating new ideas or evidence – it’s reliably executing what we already know works.
This is especially true in primary care, a complex adaptive system where improvement ought to happen not primarily through RCTs but through measuring what matters and then tinkering, learning, and iterating. In the OAT example, you don’t need a meta-analysis to tell you patients cycle off treatment. The frontline needs better systems that support them coming back.
That said, research still has an important role. Despite best efforts in QI, some clients with OUD don’t initiate or remain on OAT. Here, research might help explore promising new pharmacologic formulations, innovative behavioural interventions, or novel ways to co-design treatment pathways with patients. Studies like the SIFI Study – exploring whether rapid IV fentanyl induction can help patients reach therapeutic doses of methadone or Kadian more effectively – address persistent gaps that QI alone can’t solve.
But the key here is sequencing: Improve what you can now, with Whole System Quality, and systems thinking, engage with Evaluation for larger initiatives, and research what remains unknown.
THE SHINY NEW TOOL – And let’s not forget the newest shiny tool in the shed: predictive analytics. In the OAT example, a team may be tempted to skip ahead and apply machine learning to get a model that “predicts” who will fall off OAT. These lofty claims can sound exciting – and sometimes prove useful – but we must avoid predictive pollyannaism (thinking that this will solve all of our problems with no downsides). Most of these models are trained on biased or limited datasets, prone to overfitting, and struggle to generalize across different clinical settings. Better to test and implement them carefully within a well-structured WSQ framework. ( For more on this, check out the book AI Snake Oil: What Artificial Intelligence Can Do, What It Can’t, and How to Tell the Difference by Arvind Narayanan and Sayash Kapoor)
The Wrong Toolkit: Paying for Quality
There’s another dimension to the Wrong Toolkit problem that we can’t ignore: how we pay for primary care. Financial incentives shape behaviour (See Circle 4 – Human Targets), and right now, many payment models in primary care reward attachment and volume – how many patients you have, how many visits you do – without asking whether the care is actually getting better over time.
This isn’t to say attachment and access don’t matter. They obviously do. But if financial incentives only measure the “how much” and never the “how well”, we’re sending a clear signal about what the system values – and it isn’t quality.
On the other hand, tying payment directly to specific clinical quality outcomes (e.g. percentage of diabetics with HbA1c below target) brings us right back to the perils of Circle 4 – Goodhart’s Law, gaming, and all the rest. It also raises legitimate concerns about equity, since clinicians serving more complex populations may be penalized for outcomes they can’t fully control.
Meanwhile, look at where the money actually flows. Healthcare systems routinely fund research and evaluation – there are grants for clinical trials, contracts for program evaluations, entire departments built around these functions. But frontline quality? The teams and structures that actually do the day-to-day work of measuring, testing, and improving care? Chronically underfunded, if funded at all. In most primary care settings, there is no dedicated quality team, no protected time for improvement work, no data infrastructure purpose-built for learning. Clinicians are expected to improve on top of everything else, with no structural support to do so. We fund the discovery of what works and the evaluation of whether it worked – but not the actual doing of the improvement itself.
So what’s the right approach? I don’t think we’ve landed on a definitive answer yet, and I suspect it will need to be iterative (sound familiar?). But I do think the evidence points toward a middle path: financial incentives that support the infrastructure needed for quality work – protected time for QI, data tools, facilitation capacity, peer learning structures – rather than trying to directly pay for outcomes. Quality needs to be built into the structures of our frontlines and supported financially, not treated as a side project that clinicians squeeze in between patients. Invest in the conditions that make improvement possible, and trust that better outcomes will follow. This is essentially investing in Whole System Quality capability, and it’s a fundamentally different bet than pay-for-performance.
The question for our system leaders and funders is whether they’re willing to make that bet – to fund the process of getting better, not just the appearance of being good.
So what does this all mean for how we move forward? It comes back to our shared understanding of Quality. Once we’ve defined what matters to our patients, teams, and system, we align structures through Quality Planning, test changes through QI, and monitor outcomes through Quality Control. When we see gaps in our outcomes, we can fill them with targeted QI efforts. For larger initiatives, Evaluation can help connect clinic level outcomes and process improvements to the value they hold for the broader healthcare system, as well as explore enablers and barriers. And when all these efforts run into persistent uncertainty or unexplained challenges, that’s when we turn to Research to explore new interventions or ways of thinking.
In this way, evaluation and research don’t replace QI – they complement it, used intentionally and at the right point in the journey.
QUALITY CONTROL – Here we are talking about the internal team doing routine checks on quality for important outcomes, not “quality assurance”, where we submit to auditing by external groups. Think of analogies in manufacturing, where pill containers may be routinely checked for contaminants, or the airline industry, where maintenance checks are supposed to ensure that panels don’t fall off the plane after take-off!
Measurement for QI needs to be timely, simple, and aimed at supporting teams to learn. We don’t need to prove the universe is expanding – we just need to know whether our new call-back script worked last week.
So how do we choose the right tool?
Start with three questions:
- What is the purpose? (Learning, discovery, accountability?)
- Who is asking?
- What will they do with the answer?
If you’re trying to make local improvements, choose local tools. Use annotated run charts or control charts. For many clinical topics, HDC Discover makes this possible without laborious data collection and database curation. Predict. Test, learn, repeat.
The biggest sin in this circle isn’t picking the wrong tool – it’s not knowing what job you’re trying to do in the first place.
From HDC’s Clinical Data Stewardship Committee (CDSC) – Exaltations
- Don’t conflate Quality, Research, and Evaluation. They serve different purposes and can complement each other.
- Understand what Quality means in your local context, and use Quality Planning, QI, and Quality Control to move towards your goals and sustain outcomes – this is Whole System Quality
- Use Research when gaps persist, but start with a Quality framework and improvement cycles
- Most improvement in complex systems ought to come from applying known solutions systematically, not discovering novel approaches through research or relying on Predictive Analytics
- Ask: What’s the purpose? Who’s asking? What will they do with the result?
- Consider engaging with Evaluators for assessing larger initiatives, connecting outcomes to the broader system, and building capability for Whole System Quality within your organization
- Empower teams to measure over time and not just compare snapshots
- Align financial incentives with quality infrastructure – frontline quality is classically underfunded compared to research and evaluation. It needs to be built into the structures of our frontlines and supported financially, not bolted on as an afterthought
Sometimes the wrench is exactly what you need. But not if you’re trying to cut down a tree.
Glossary of Terms
- Control chart (SPC chart): A run chart with statistically derived upper and lower control limits. Helps distinguish “common cause” variation (inherent to the system) from “special cause” variation (something changed). Used in Quality Control to monitor whether a process is stable.
- Driver diagram: A visual tool used in QI that maps the aim (what you’re trying to achieve), primary drivers (the key factors that influence the aim), secondary drivers (specific actions or conditions), and change ideas (what you’ll test). Think of it as a practical, iterative theory for change.
- Goodhart’s Law: “When a measure becomes a target, it ceases to be a good measure.” The principle that once you attach incentives or consequences to a specific metric, people will optimize for the metric rather than the underlying goal. A recurring theme in the Circles series (see Circle 4).
- Logic model: A structured framework used in Evaluation that maps inputs, activities, outputs, outcomes, and impact in a linear chain. Useful for program accountability, but can oversimplify complex adaptive systems where feedback loops and emergence matter.
- PDSA cycle (Plan-Do-Study-Act): The core engine of QI. A rapid, iterative cycle for testing changes: Plan what you’ll test and predict what will happen, Do the test on a small scale, Study the results against your prediction, Act on what you learned (adopt, adapt, or abandon). See Langley et al., The Improvement Guide.
- P-value: The probability that the observed result (or something more extreme) would occur by chance alone if there were truly no effect. Conventionally, p<0.05 is considered “statistically significant” – but statistical significance is not the same as practical significance (see “oomph”). Small samples in QI projects often produce “non-significant” p-values for effects that are clinically meaningful and worth pursuing.
- Quality Control (QC): The routine, ongoing monitoring of key outcomes to ensure they remain stable and within expected limits. Not the same as “quality assurance” (external auditing). Think of it as the internal team keeping an eye on the dashboard to catch problems early.
- Quality Improvement (QI): A systematic approach to making healthcare processes and outcomes better, using iterative testing (PDSA cycles), measurement over time, and frontline engagement. Distinct from research (which seeks generalizable knowledge) and evaluation (which assesses program worth).
- Quality Planning (QP): The process of defining what quality means in your context – identifying the outcomes that matter most to patients and teams, and designing systems and processes to deliver them. The “upstream” work that makes QI and QC possible.
- RCT (Randomized Controlled Trial): A research study design in which participants are randomly assigned to an intervention or control group. Considered the gold standard for establishing causality in research, but often impractical for frontline improvement work due to sample size requirements, timelines, and the need to control for context rather than learn from it.
- Run chart: A graph of data plotted over time with a median line. Used in QI to detect patterns such as trends, shifts, or runs that indicate a process has changed. Simpler than a control chart but powerful for frontline teams tracking their own outcomes.
- Theory for Change (ToC): A model or hypothesis about how and why a set of actions will lead to desired outcomes. In QI, this is a working model that’s adapted iteratively (often expressed as a driver diagram). In Evaluation, it’s a more structured logic model designed upfront and revisited over time.
- Whole System Quality (WSQ): An organizational approach that integrates Quality Planning, Quality Improvement, and Quality Control across all levels – from frontline teams to senior leadership. WSQ embeds the capability to define outcomes, measure progress, test changes, and sustain gains within the organization itself, rather than relying solely on external evaluators or researchers.
Bibliography
Berwick, Don. “The Science of Improvement,” JAMA, 2008 Mar 12;299(10):1182-4. doi: 10.1001/jama.299.10.1182.
Dukes, Kimberly, Jacinda Bunch, Paul Chan, et al. “Assessment of Rapid Response Teams at Top-Performing Hospitals for In-Hospital Cardiac Arrest,” JAMA Internal Medicine. 2019; 179(10):1398-1405. doi:10.1001/jamainternmed.2019.2420
McCloskey, Deirdre Nansen and Stephen Ziliak. The Cult of Statistical Significance: How the Standard Error Costs Us Jobs, Justice, and Lives. Ann Arbor: University of Michigan Press, 2008.
Narayanan, Arvind and Sayahs Kapoor. AI Snake Oil: What Artificial Intelligence Can Do, What It Can’t, and How to Tell the Difference. Princeton: Princeton University Press, 2024.
Picard, André, “Pot, Policy and Pandemics: Reflections on 40 years of health journalism.” 2023 Dalton Camp Lecture in Journalism, 23 February 2023, St. Thomas University, Fredericton, New Brunswick. Lecture.