Version 3.17 was released to production on September 23rd 2025. Please do not hesitate to contact our support email support@hdcbc.ca should you have any questions or comments about any of these changes.
What’s New?
New Dashboard for members of Division Organizations
We have introduced a new dashboard within the Discover application available to the Division users. This is designed to give division users a more complete and actionable view of activity across clinics in their division. The goal is to provide a practical and easy-to-use tool that highlights key insights into clinic participation, patient access and attachment, and overall population health.
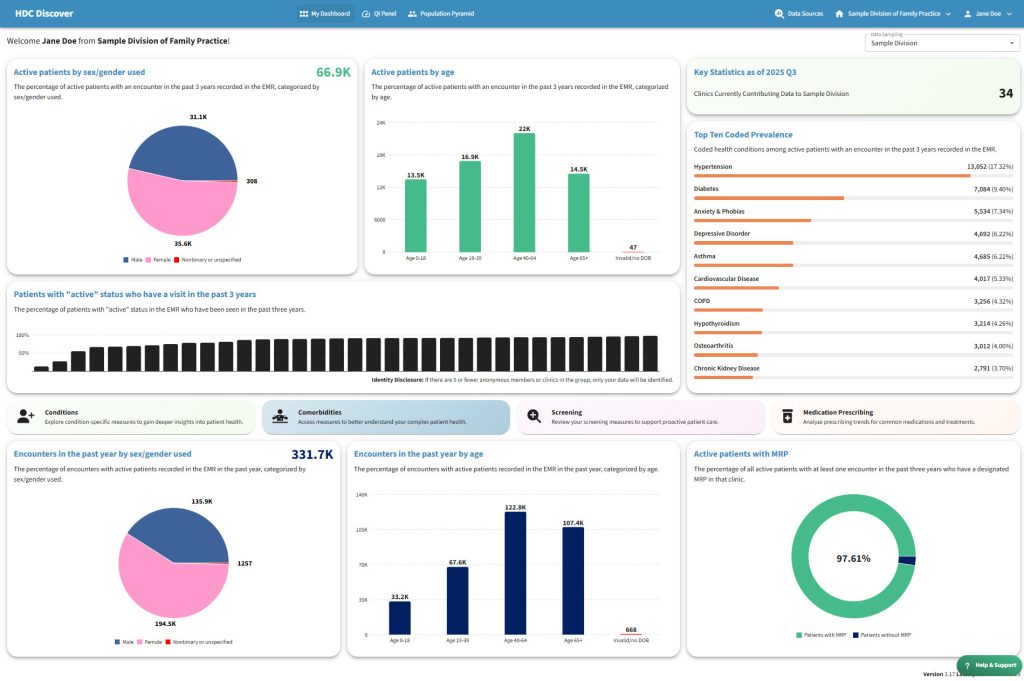
Key Insights Include:
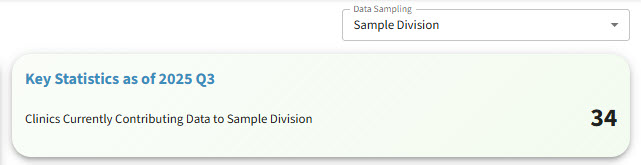
Statistics of Clinic Participation: This feature shows the total number of active clinics that are currently contributing data.
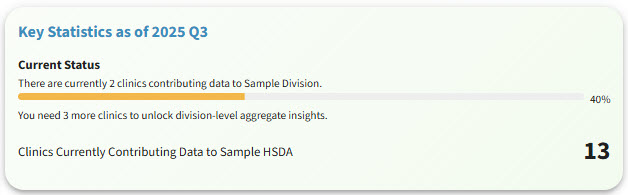
To protect anonymity, divisions with fewer than five active data-contributing clinics will not display division-level aggregate statistics. Instead, the dashboard will indicate how many additional clinics are needed to unlock division-level insights. In these cases, users will still be able to view participation statistics at the HSDA, HA, and provincial (BC) levels, with the option to switch between them.
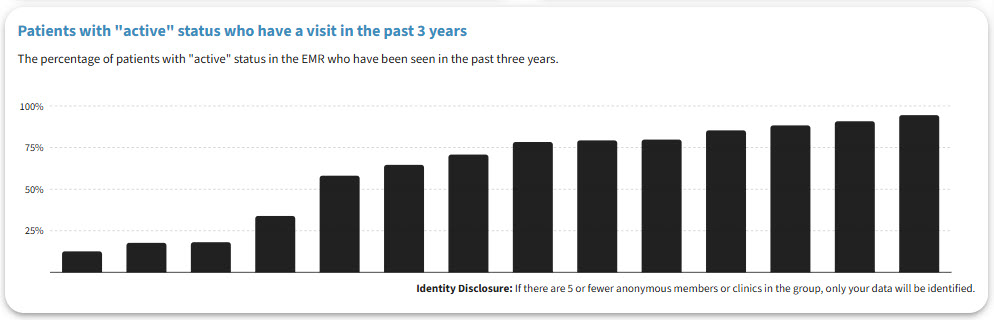
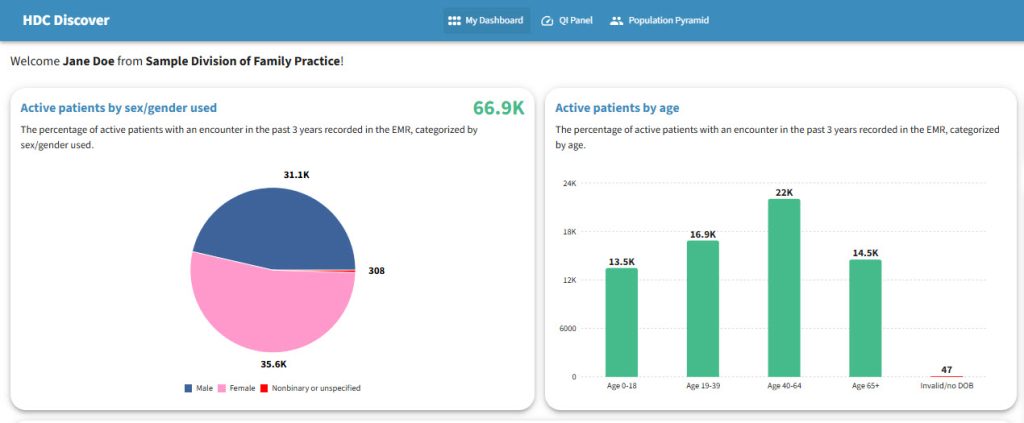
Patient Access Insights: The dashboard also displays the percentage of active patients who have has a visit in clinics associated with the division. This measure shows how well patients are engaging with available services and helps divisions quickly identify whether patients are accessing care in a timely and consistent way.
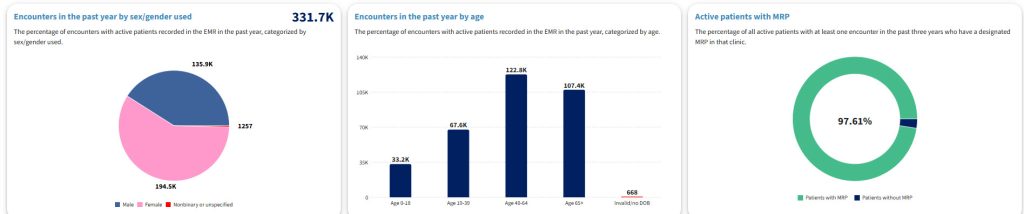
Population Breakdown: The dashboard includes demographic breakdowns by age, sex/gender used, providing insights into the composition of active patients and encounters. Understanding population trends supports service delivery and helps divisions target resources to meet the specific needs of different patient segments.
Attachment Monitoring: Users can view the percentage of active patients with a Most Responsible Provider (MRP) assigned. Divisions can use this metric to monitor attachment rates and identify clinics or patient populations that may need additional support to ensure continuity of care.
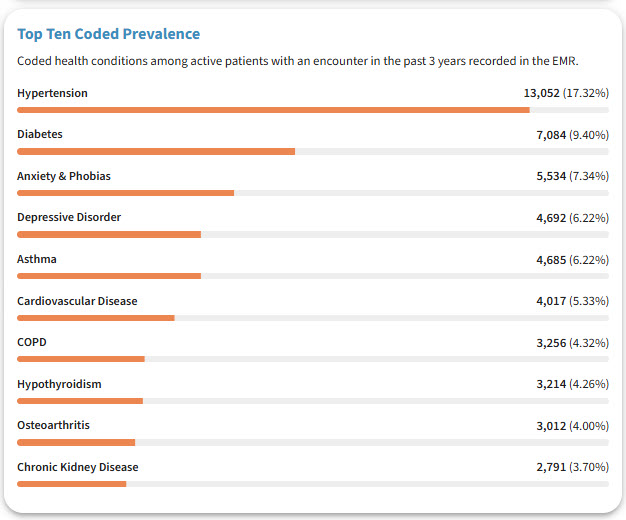
The top 10 most prevalent coded health conditions among active patients are displayed, giving divisions a clear view of the most common clinical needs.
Login now to see your dashboard in action. For more information or questions around the new dashboard, please contact support@hdcbc.ca
Improvements
Consistent Data Sources across all views
When users navigate from the dashboard to Single Measure View, the application now detects the active data sampling source selected on the dashboard and dynamically adds it to their data source list. This improvement ensures data consistency across views and eliminates confusion when moving between the Dashboard, Single Measure View and QI Panel
Note: For more information or questions, please contact support@hdcbc.ca.