
As the data hell-evator bounces to a halt one floor down, a black-tuxedoed white-gloved young man with slicked back hair and perfectly symmetrical facial features materializes adjacent to the opening door, smiling perfectly and promptly bowing, his gloved hand waving you into the ornate candlelit room. The room is oddly inviting, with pleasing classical music and long tables fit for fine dining set up with facing large screens. In the distance you see one or two more tuxedo-adorned folk, and is that man wearing a monocle? But more striking is right in front of you, a smiling woman wearing a yellow-flowered dress and what appears to be a cooking apron, but with red heels and lipstick more befitting a 1950s washing machine ad. She flashes her perfectly white symmetrical teeth and motions for you to sit down at the table, a chair facing the large screens. The gender roles are a little on the nose, you think, but the atmosphere feels welcoming. As the images come into focus on the screen, it seems you are at the fanciest dinner healthcare data party ever. Maybe all has been redeemed and you’ve exited the Circles? Those are the most visually appealing bar graphs you’ve ever seen, and you wonder how they make them appear in such shimmering gold. But is something off? How long did it take these people to prepare for all this? Which Health Authority or PQI program signed off on this? Did that Anne Hathaway-looking hostess’ neck just rotate in an oddly robotic jolt?
Welcome to the next Circle of healthcare data hell, where it’s all about keeping up appearances. The data is cleaned with the goal of maximum accuracy and like in Ira Levin’s novel-turned film The Stepford Wives, the goal is nothing short of perfection, which comes at great cost. Here, perfect becomes the enemy of the good. Improving accuracy becomes at odds with improving quality. We know that data entry into EMRs is sometimes wanting, and our simple measures’ accuracy can be limited by documentation habits. When folks like researchers or policymakers then want to use this data, the data is often “cleaned”. This can mean that complex algorithms are used based on EMR data entry or that multiple data sources are linked on the back end (invisible to the frontline team) to provide the most “accurate” measure results.
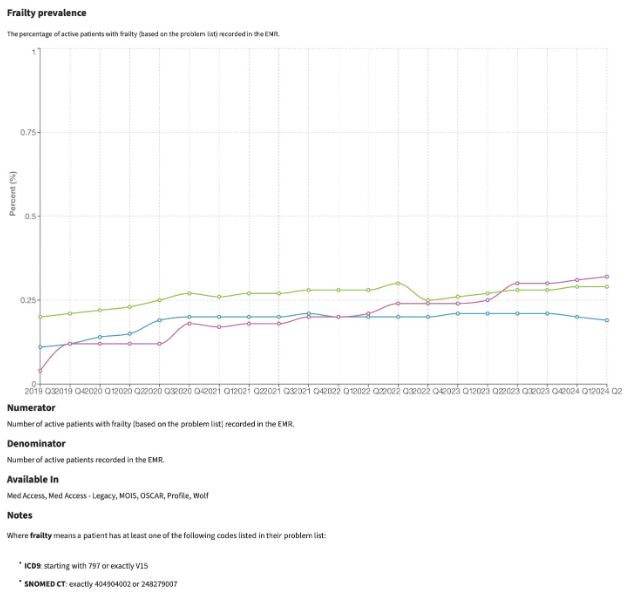
A great example here is frailty. We are not very good at documenting this in clients’ problem lists across the province, and so coming up with prevalence estimates based on EMR data necessitates looking for other clues in the chart. In the graph below, we see data from all of BC in the green line, along with data from two health authorities (purple and blue). The graph shows that only about 1 out of 400 patient records has Frailty documented as a coded health condition in the EMR, and we know this is much smaller than the true prevalence.
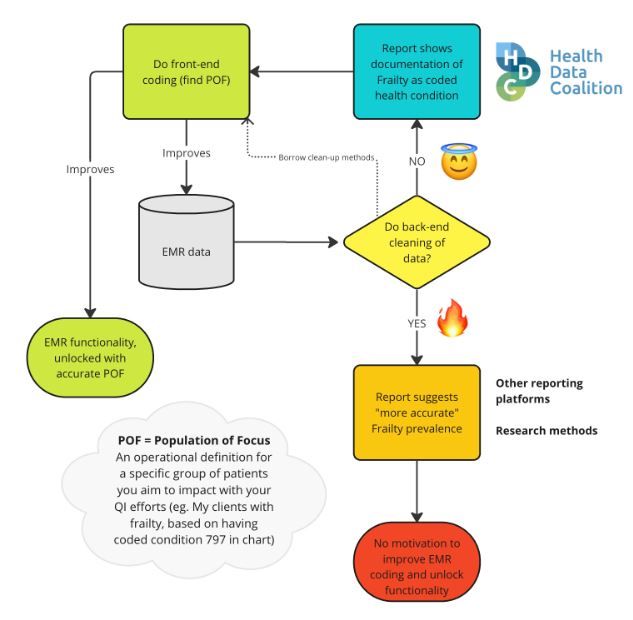
Now at this point, the urge may be to start “cleaning”, running back-end algorithms to get us a more “accurate” number to report. Surely this will be more useful? But wait a minute here, it really depends on the purpose of the measures, and we suggest a different path if we are primarily concerned with QI at the frontlines. Starting with the EMR data in our diagram above, we see a key decision point when it comes to back-end cleaning, as outlined in my flow diagram below. One path leads to a virtuous cycle, while the other, in the style of this article series, to the fiery depths. Indeed, we see evidence that some clinics on the HDC platform do reliably code frailty, and so their simple HDC measure corresponding to their Population of Focus has become a trustworthy indication of the true prevalence in their clinic, and they can now use their EMR functionality to improve the care of this group.
Back-end cleaning is sometimes warranted, but when the purpose is using measures for frontline quality improvement, we risk being led astray. Back-end cleaning takes time and resources that frontline teams often don’t have. By the time the pristine data is served, it may be too outdated, not timely enough to detect changes in a meaningful way. There’s also something less trustworthy about the data when this back-end cleaning occurs, and it becomes a complex path from EMR data input to measure output.
It becomes harder to create patient lists based on the measures, and false positives are more likely to appear on those lists (e.g. the problem list contains some text saying “NOT frail,” but the algorithm counts this patient as frail). Specific to frontline use, back-end cleaning reduces the incentive for good frontline documentation habits. Good frontline documentation habits lead to benefits in patient engagement, practice workflows and quality improvement, which go beyond the sole purpose of improving accuracy of measures.
If the frontline team wants to improve care for their frail clients, a good initial step would be to get a clearly defined Population of Focus (POF). This would include using some queries to find likely candidates and then applying a standard coded problem in the problem list. Here, we can borrow some of the methods of the back-end cleaners, but instead employ them in our EMR to suggest a list of clients where we may have missed coding. With this approach, we keep our measure simple and unlock some features of our EMR, like the ability to get up-to-the-minute data in reports or dashboards or apply batch changes to our POF (e.g. send out an email questionnaire). We make explicit the benefits of good documentation habits, thus encouraging more of the same, and ultimately improving our data accuracy as a result.
Here we recognize and account for the differences between measurement for QI and other things like research or evaluation. In QI, our data needs to be timely and good enough when used as a tool to detect improvements over time, not to get the most accurate spot estimate of reality (or often a reality that existed many months ago before data cleaning).
In other words, when it comes to QI, we don’t need perfectly cleaned data served in a pristine fine dining experience, because we won’t be able to sustain this and it detracts from our primary purpose. We need “data that’s good enough,” measures that are simple and straightforward and fit with our QI process where we can benefit from good documentation habits.
CDSC exaltations
- QI data needs to be timely and “good enough”, and excessively cleaning or searching for the perfect data is not warranted
- Simpler measures that rely on proper EMR documentation are preferred over complex measures that require back-end cleaning, that can encourage more “garbage in garbage out”
- EMR tools and PSP support can be harnessed to find your Population of Focus (POF), and this unlocks advanced EMR functionality
- The value of proper EMR documentation becomes explicit when teams start regularly doing QI and harnessing EMR functionality that relies on this practice